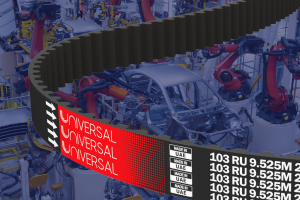
V-Belt reliability engineering is essential for ensuring consistent performance in industrial power transmission. In mechanical systems, downtime due to belt failure leads to significant productivity losses. Engineers must therefore analyze every factor that influences belt performance: load capacity, efficiency losses, fatigue mechanisms, and predictive maintenance methods.
This article provides a technical framework for analyzing V-Belt reliability, drawing from mechanics, material science, and international standards. For additional technical resources, see the Universal Rubber Belt catalog.
Power Transmission Fundamentals in V-Belt Reliability Engineering
The mechanics of belt drives are governed by the Euler-Eytelwein equation, which describes the relationship between tight-side and slack-side tensions: T1T2=eμθ\frac{T_1}{T_2} = e^{\mu \theta}T2T1=eμθ
Where:
- T1T_1T1 = Tight-side tension (N)
- T2T_2T2 = Slack-side tension (N)
- μ\muμ = Coefficient of friction
- θ\thetaθ = Wrap angle (radians)
Power transmitted is given by: P=(T1−T2)⋅vP = (T_1 – T_2) \cdot vP=(T1−T2)⋅v
Where vvv = belt velocity (m/s).
In V-Belt reliability engineering, these relations are critical. They determine load capacity, help prevent slip, and guide engineers in belt section selection.
Efficiency Loss Mechanisms in V-Belt Reliability Engineering
Slip-Induced Losses
Real-world systems always exhibit small slip. Even 1% slip reduces efficiency and generates heat. Slip is directly tied to insufficient tensioning and misalignment.
Hysteresis Losses
Rubber materials dissipate energy under cyclic bending. This hysteresis contributes to internal heating and reduces efficiency.
Temperature Dependence
Above 80°C, rubber modulus decreases, reducing stiffness and increasing elongation. This lowers transmission reliability.
Comparative Efficiency
- V-Belts: 90–96%
- Timing Belts: 96–98%
- Chains: 98–99%
More details are found in ISO 4184 Classical V-Belts.
Load Capacity in V-Belt Reliability Engineering
Belt Geometry
Classical (A, B, C, D) and narrow (SPZ, SPA, SPB, SPC) belts exhibit different ratings. Narrow belts achieve higher power density for the same width.
Groove Angle
Groove angles (34°–40°) impact torque transmission. Narrower grooves improve grip but accelerate sidewall wear.
Derating Factors
- Temperature >70°C → factor 0.85
- Oil mist → factor 0.9
- Humidity → delamination risk
Example Calculation
For 15 kW at 1500 RPM, pulley 200 mm:
- Belt speed = 15.7 m/s
- T1/T2=2.5T_1/T_2 = 2.5T1/T2=2.5
- T1−T2=955 NT_1 – T_2 = 955 \, NT1−T2=955N.
Such worked calculations form the backbone of V-Belt reliability engineering when sizing drives.
Failure Analysis in V-Belt Reliability Engineering
Failures offer diagnostic insight:
Sidewall Wear
Caused by pulley misalignment or abrasive contact.
Glazing
Slippage generates heat, hardening the belt surface and reducing flexibility.
Cord Breakage
Shock loads or fatigue can fracture polyester or aramid cords.
Cracking
Thermal and ozone degradation initiates microcracks that propagate under cyclic load.
Delamination
Layer separation results from fluctuating loads and humidity ingress.
Fatigue curves (S-N) show life reduction at higher stresses, a central concept in V-Belt reliability engineering.
Diagnostic and Predictive Methods in V-Belt Reliability Engineering
Vibration Analysis
FFT identifies misalignment and slip through abnormal peaks.
Thermal Imaging
Infrared thermography detects slip-induced heating. A 10–15°C rise signals early degradation.
Finite Element Analysis (FEA)
Stress modeling of cords and elastomer predicts crack initiation zones.
Machine Learning Models
AI systems use vibration and temperature data to forecast replacement intervals more accurately than fixed-hour schedules.
Case Studies in V-Belt Reliability Engineering
Steel Rolling Mill
- Problem: Cord fatigue due to torque variation.
- Solution: Aramid reinforcement reduced elongation and improved life by 30%.
Agricultural Harvester
- Problem: UV and ozone exposure led to premature cracking.
- Solution: Ozone-resistant compounds extended service life by ~25%.
Standards
International standards define performance and testing:
- ISO 4184 – Power rating methods.
- ISO 5290 – Narrow belt tolerances.
- ASTM D4482 – Rubber fatigue testing (source).
- DIN 2215 – General belt standards.
Testing methods include accelerated fatigue, environmental chamber simulation, and dynamic rigs.
Engineering Recommendations for V-Belt Reliability
- Maintain pulley alignment <0.5°.
- Use ISO-based pre-tension methods.
- Replace belts when elongation >3% or cracks >1 mm.
- Use cogged designs in high-speed applications.
- Inspect vibration data every 2,000 operating hours.
For detailed product data, visit Universal Rubber Belt contact page.
FAQs
Q1: How is V-Belt efficiency measured?
Efficiency = (Output power ÷ Input power) × 100%. V-Belts typically achieve 90–96%.
Q2: What causes early V-Belt failure?
The main causes are misalignment, poor tensioning, excessive slip, and environmental degradation.
Q3: Which standards regulate testing?
ISO 4184, ISO 5290, ASTM D4482, and DIN 2215 are most common.
Q4: How often should belts be replaced?
Every 2,000 hours of operation or when elongation exceeds 3%.
Conclusion
V-Belt reliability engineering combines design calculations, material science, and predictive diagnostics. Engineers improve belt reliability by calculating accurate load capacity, minimizing efficiency losses, and adhering to international standards.
This discipline demonstrates that belt performance is not determined by chance but by rigorous technical evaluation of stresses, fatigue, and diagnostics.


